Conversion Rate Optimization Landing Page: 11 Fixes [2026]
Boost conversions fast with a Conversion Rate Optimization Landing Page guide: 11 data-ranked fixes, 2026 benchmarks, and tools. Run a free audit now.
TL;DR
The median landing page conversion rate is 6.6%, but most pages sit well below that. The highest-impact fixes, ranked by data, are form field reduction (120% lift), headline and message match optimization (up to 104% lift), and page speed improvements (8-10% lift per 0.1 seconds). This guide ranks 11 conversion rate optimization tactics for landing pages by measured impact, includes tool comparisons, and gives you a prioritization framework so you stop guessing what to fix first. Run a free analysis on your page to see where you stand before reading further.
Why CRO Beats Buying More Traffic
Here’s the math that should change how you allocate budget. If your landing page converts at 2% and you push it to 4%, you just doubled your results on the same ad spend. No extra traffic needed. No increased cost per click.
According to Unbounce’s Q4 2024 analysis of 464 million visits across 41,000 landing pages, the median landing page conversion rate sits at 6.6%. Top performers hit 10-15%. Most businesses aren’t even close.
The gap between where most pages are and where they could be represents real money left on the table. Yet the instinct is almost always to buy more traffic instead of fixing the page that’s leaking conversions. A practitioner who has worked on over 1,000 CRO projects put it simply: “Most teams are not short on traffic. They are short on a system for turning that traffic into leads.”
This article gives you that system. Every tactic below is ranked by measured conversion lift, not opinions.
Conversion Rate Benchmarks You Should Know
Before optimizing anything, you need to know whether your page is actually underperforming or just performing normally for your vertical.
| Industry | Median Conversion Rate |
|---|---|
| All industries | 6.6% |
| SaaS / Technology | 3.8% |
| Ecommerce (purchase) | 2.35% |
| Financial Services | 8.4% |
| Education | 7.6% |
Here’s what most benchmark articles miss: traffic source matters more than industry. Email traffic converts at 19.3%, while organic search converts at just 2.7%. If you’re comparing your page’s conversion rate against a benchmark without accounting for where your traffic comes from, you’re drawing the wrong conclusions.
Use a conversion rate calculator to see what even a 1% lift means for your specific revenue numbers. The results are usually enough to justify a serious optimization effort.
At-a-Glance Comparison: CRO Audit and Optimization Tools
Before we get into tactics, here’s a quick comparison of the tools you’ll see referenced throughout this guide. Different tools solve different parts of the CRO problem.
| Tool | Primary Use | Starting Price | Script Required? | Time to First Insight | Best For |
|---|---|---|---|---|---|
| Conversion Score | AI page audit + prioritized recommendations | Free (limited); $99/mo Pro | No, paste a URL | ~90 seconds | Fast diagnostics, agency reporting, pre-test prioritization |
| Hotjar | Heatmaps + session recordings + feedback | Free (limited); $39/mo paid | Yes | Hours to days | Understanding why visitors behave as they do |
| Crazy Egg | Heatmaps + A/B testing | $99/mo | Yes | Hours to days | Visual behavior analysis + quick tests |
| VWO | A/B testing + personalization | $339/mo | Yes | Weeks | Serious testing programs at scale |
| Microsoft Clarity | Session replays + heatmaps | Free (unlimited) | Yes | Days | Budget-conscious teams needing behavioral data |
The key distinction: some tools show you what’s happening (Hotjar, Clarity), some let you test changes (VWO, Crazy Egg), and some tell you what to fix first (Conversion Score). Most teams need at least one from each category.
Now, the 11 tactics, ranked by data-backed impact.
1. Run an AI Conversion Audit with Conversion Score
Best for: Teams that don’t know what’s broken, agencies that need fast client diagnostics, and anyone about to start (or restart) a landing page optimization effort.
Measured impact: AI-generated landing page variants show a 37% higher conversion rate compared to human-written control pages. Conversion Score customers have reported 30-150% improvements after implementing prioritized recommendations.
Every other tactic on this list assumes you already know what’s broken on your page. Most teams don’t. They guess, pick the wrong fix, spend weeks implementing it, and see no measurable lift. The single highest-value move is starting with a structured diagnosis that tells you exactly where conversions are leaking and what to fix first.
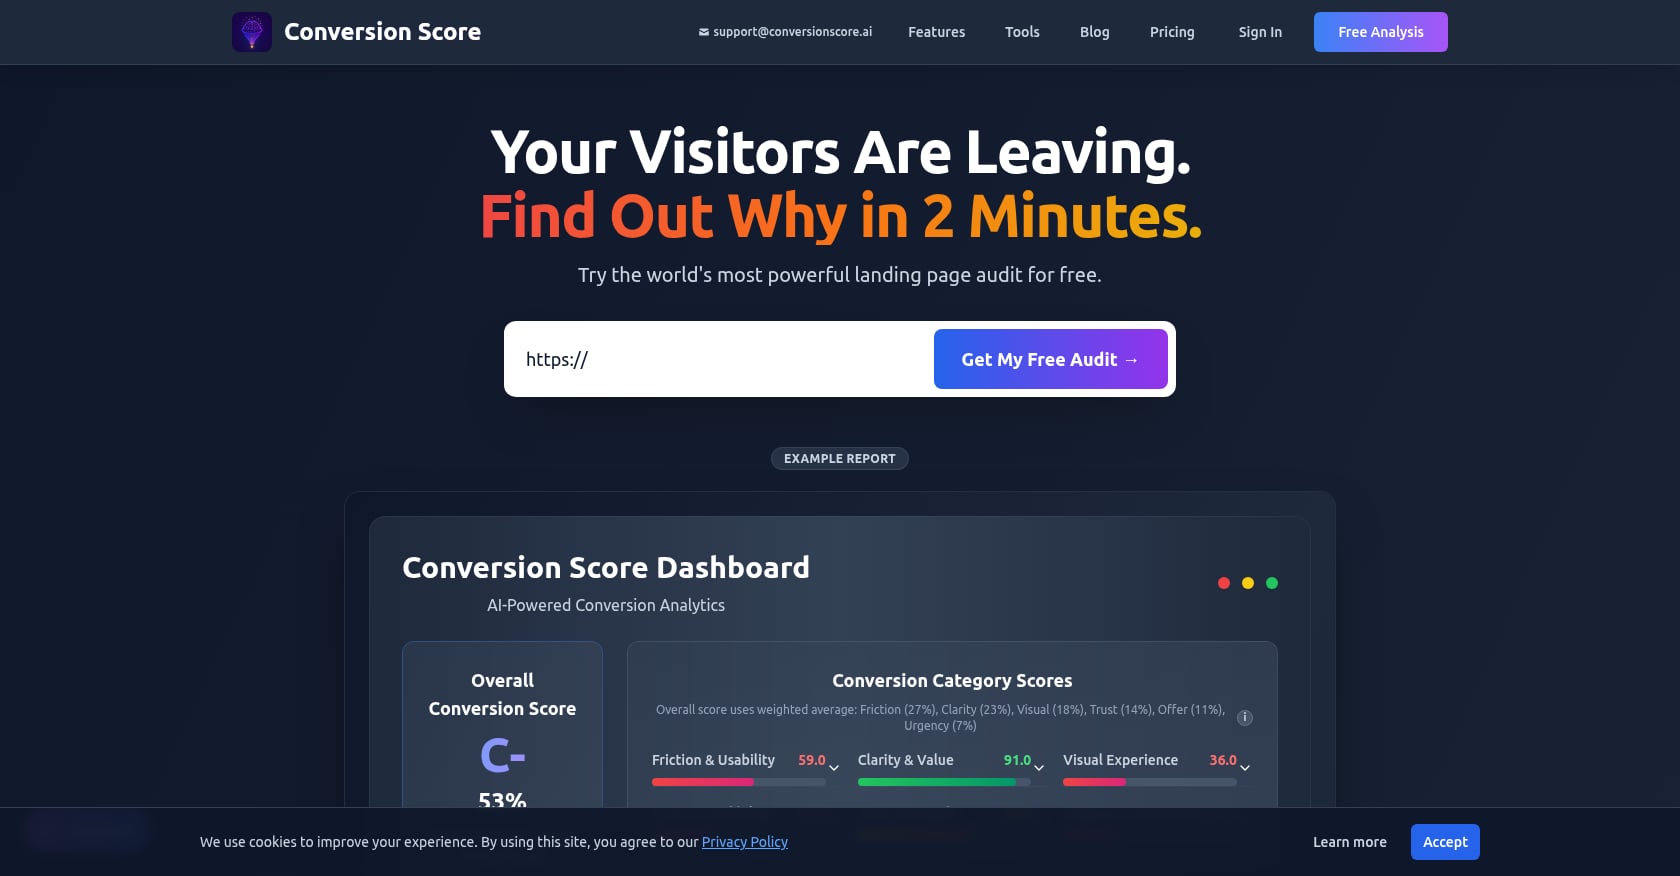
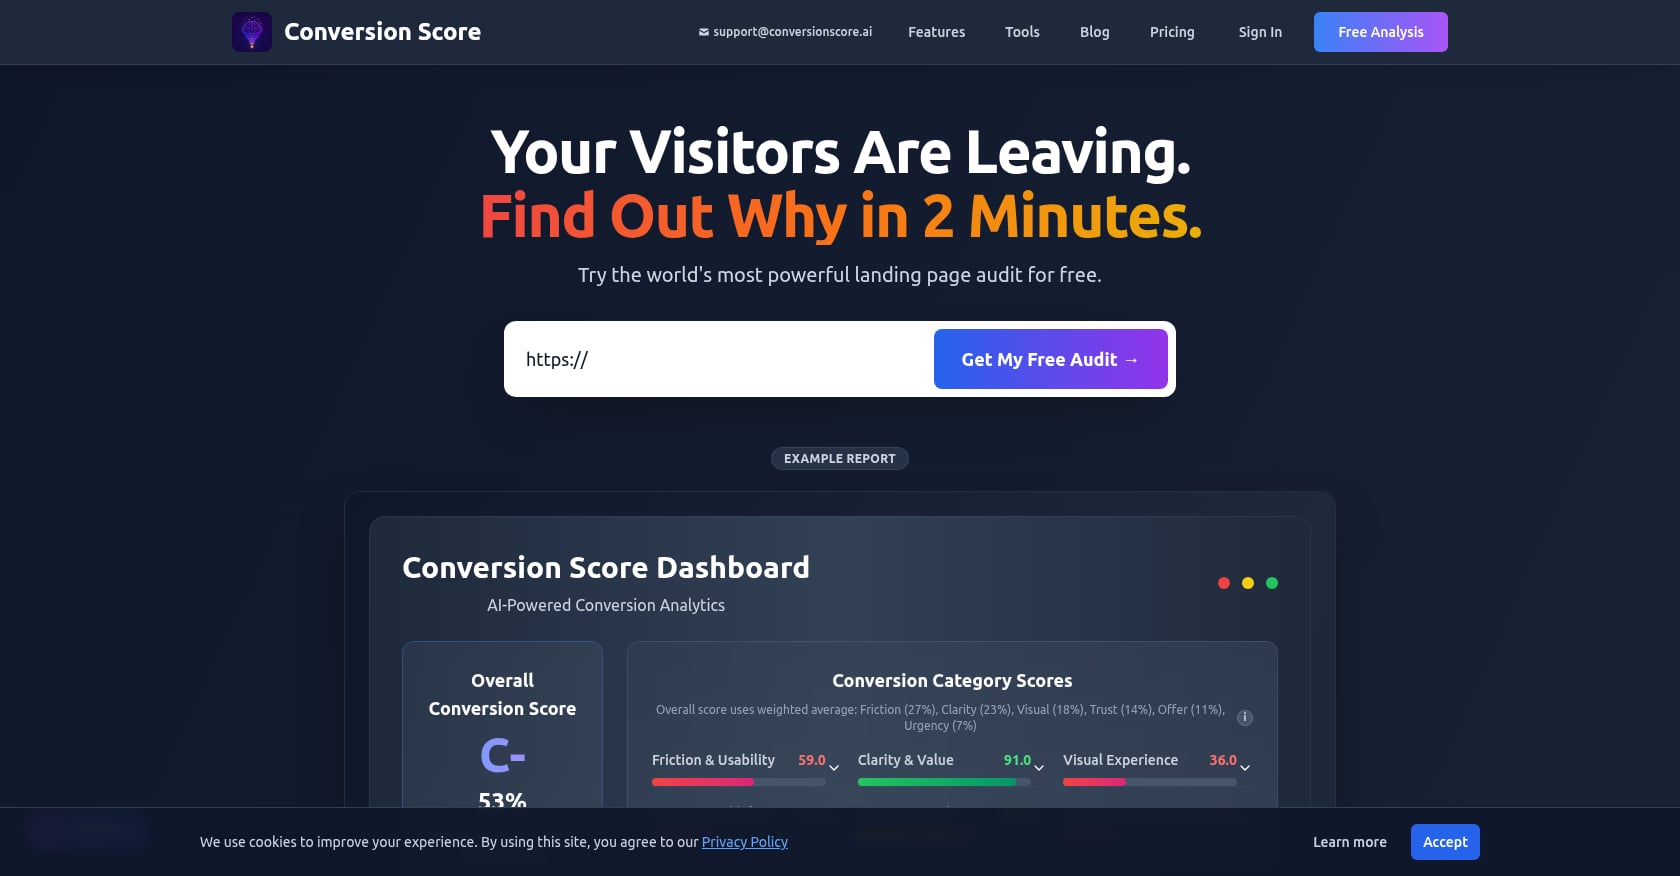
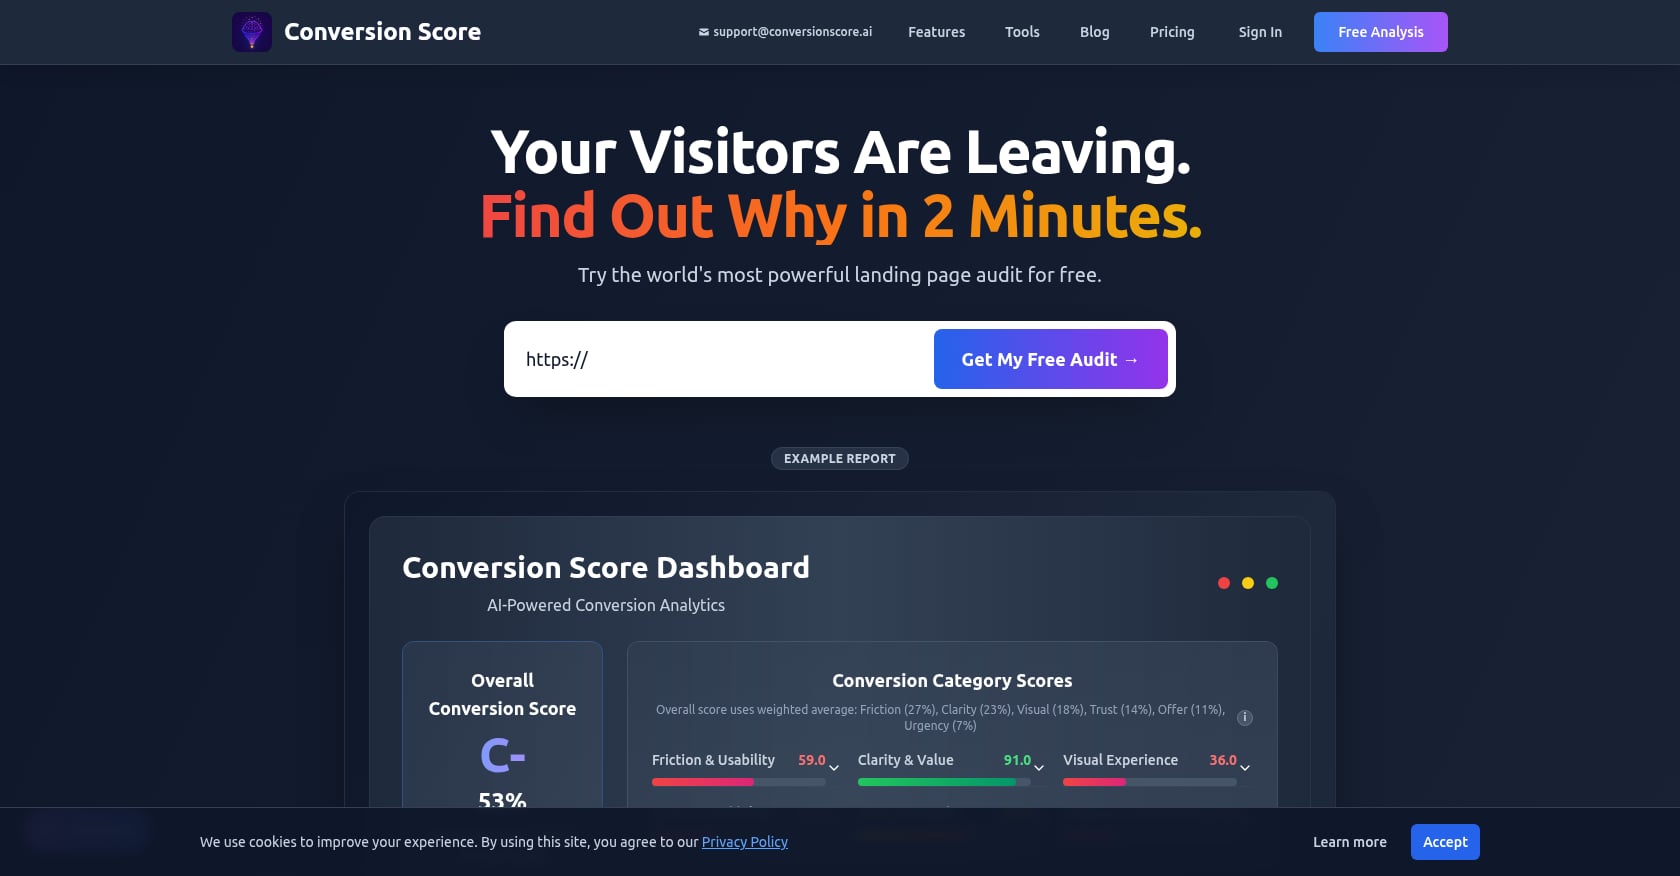
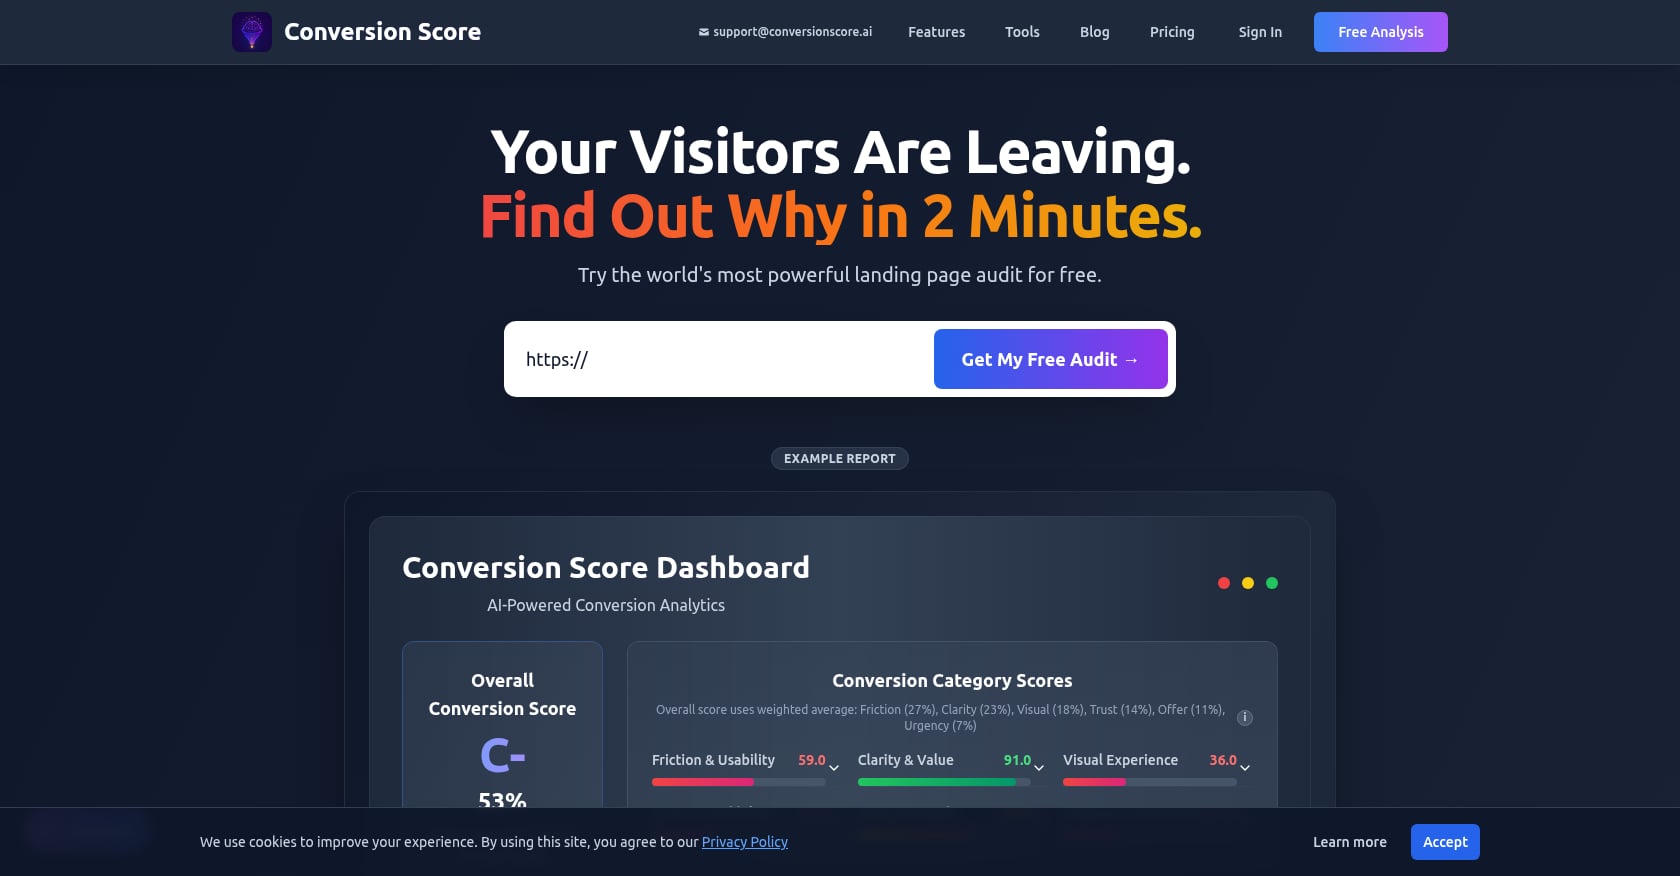
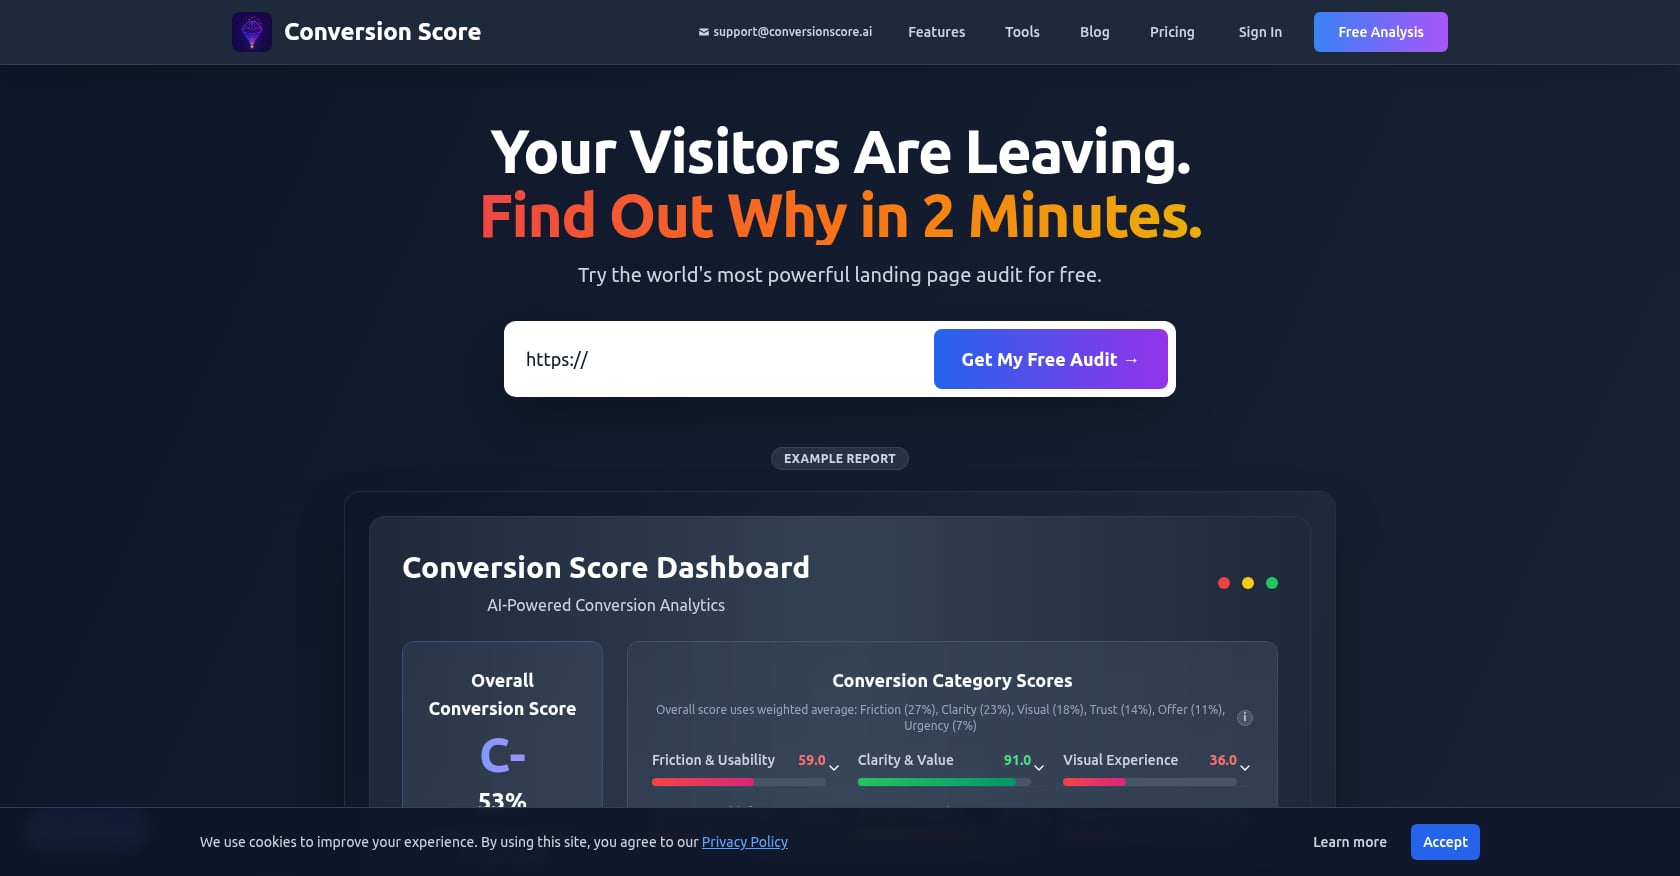
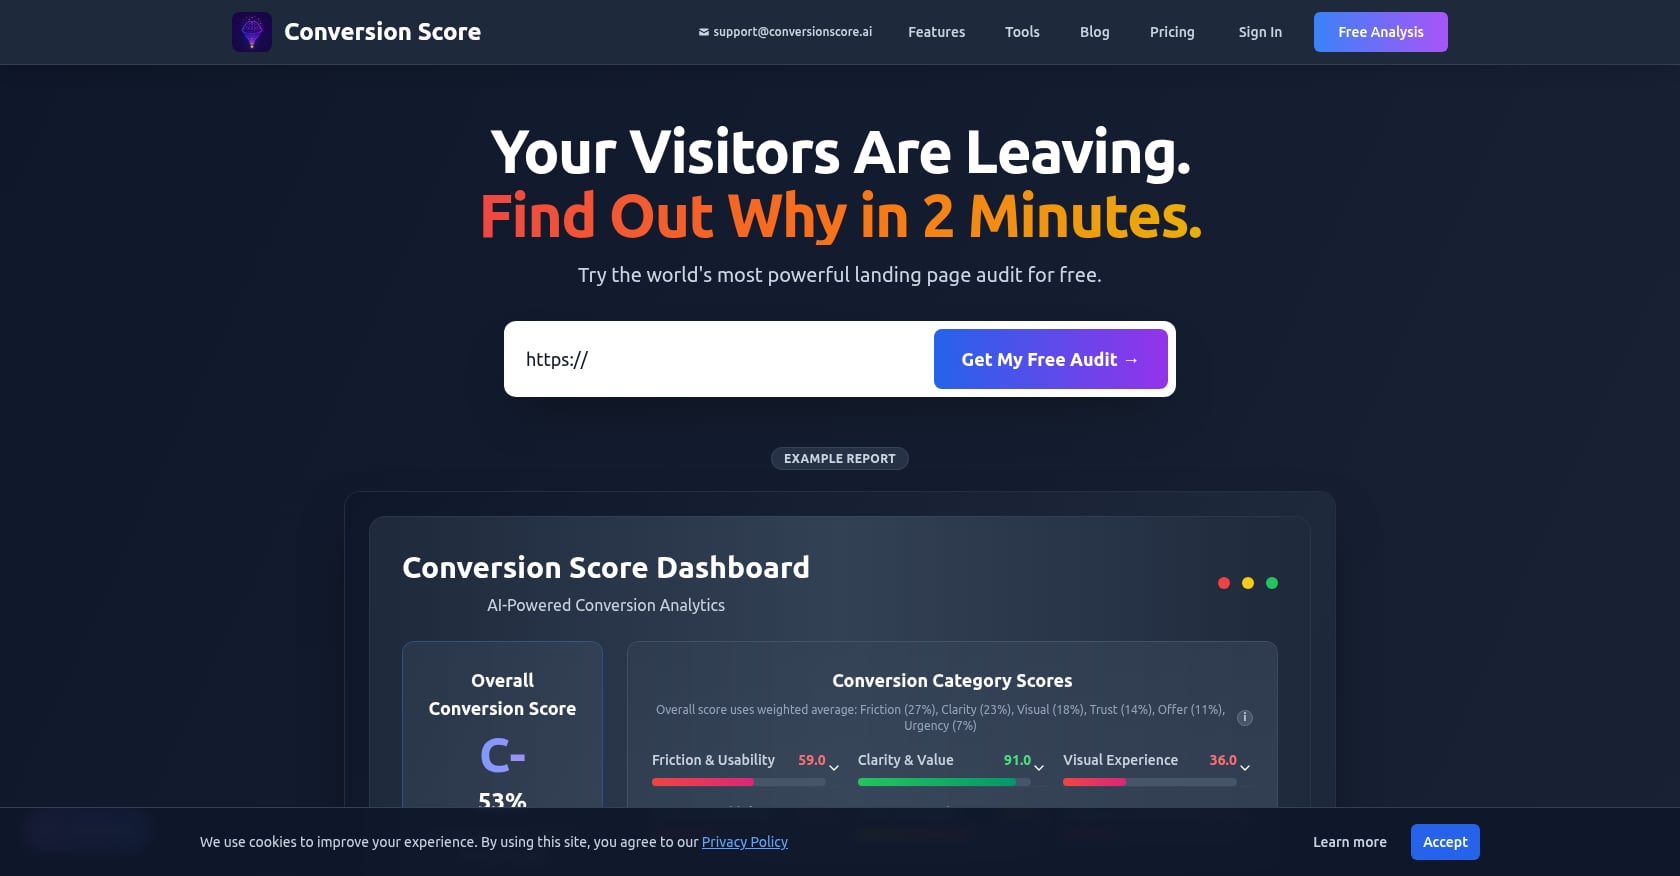
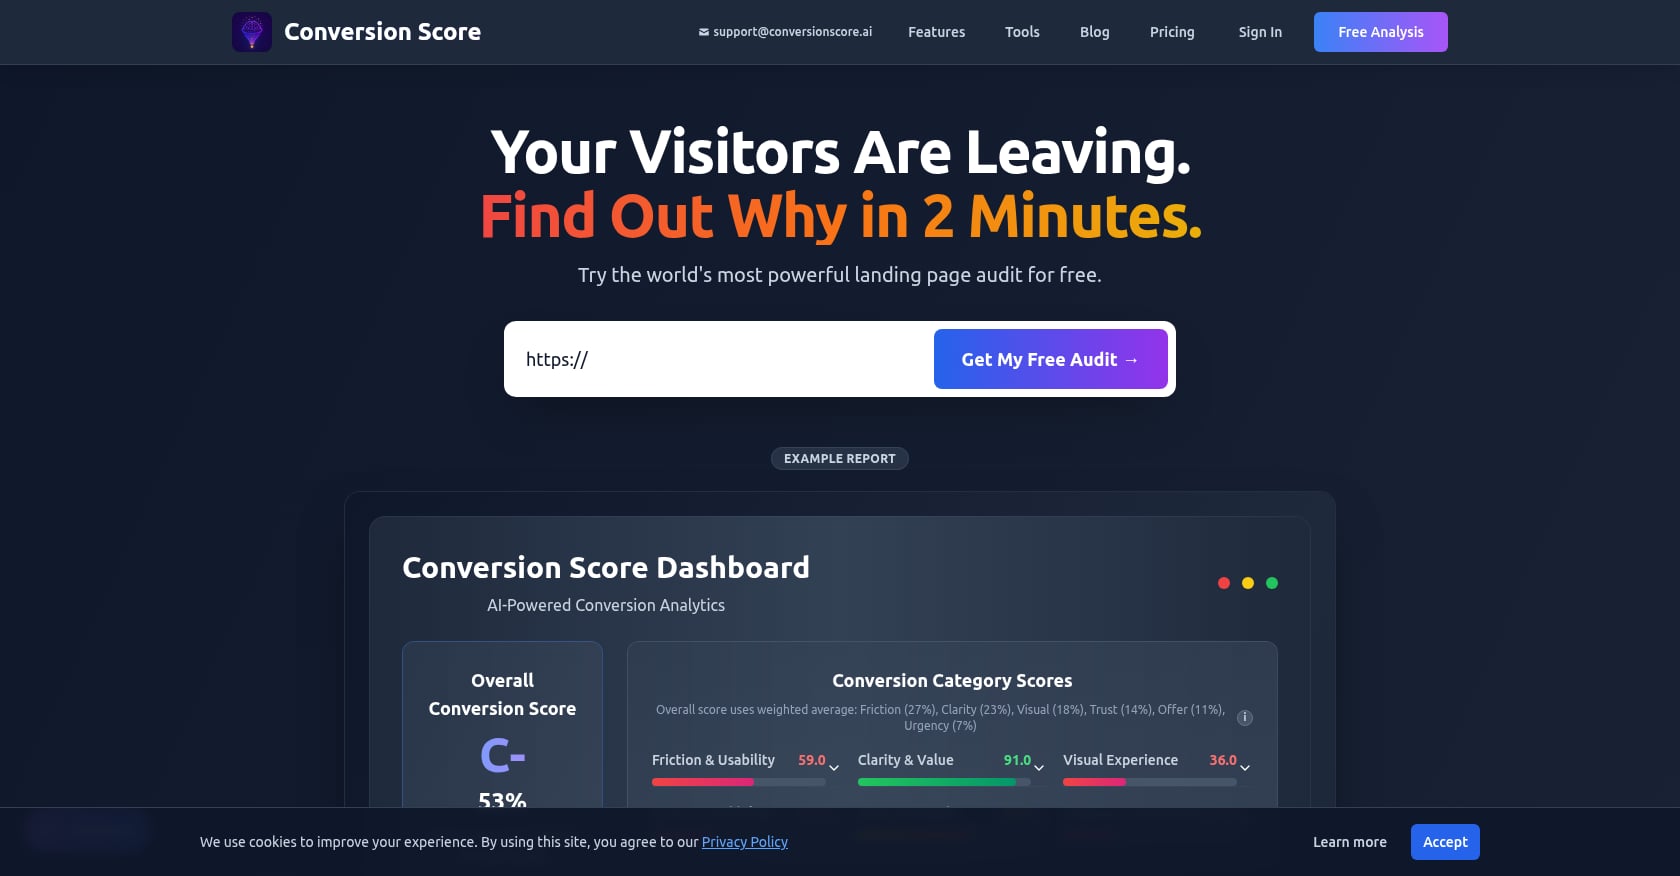
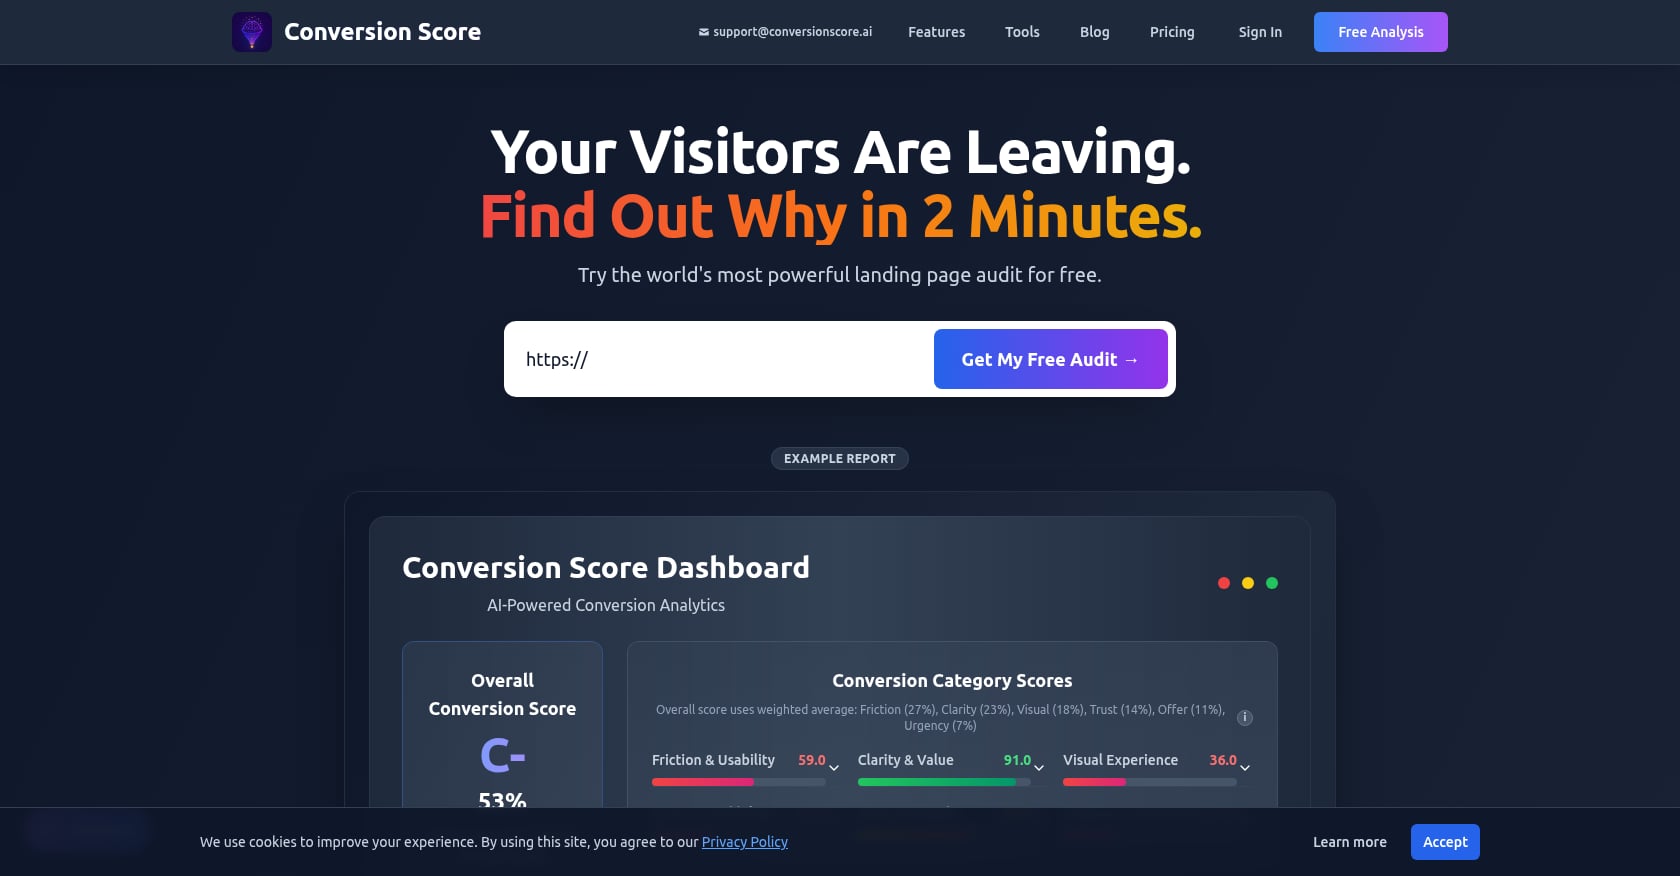
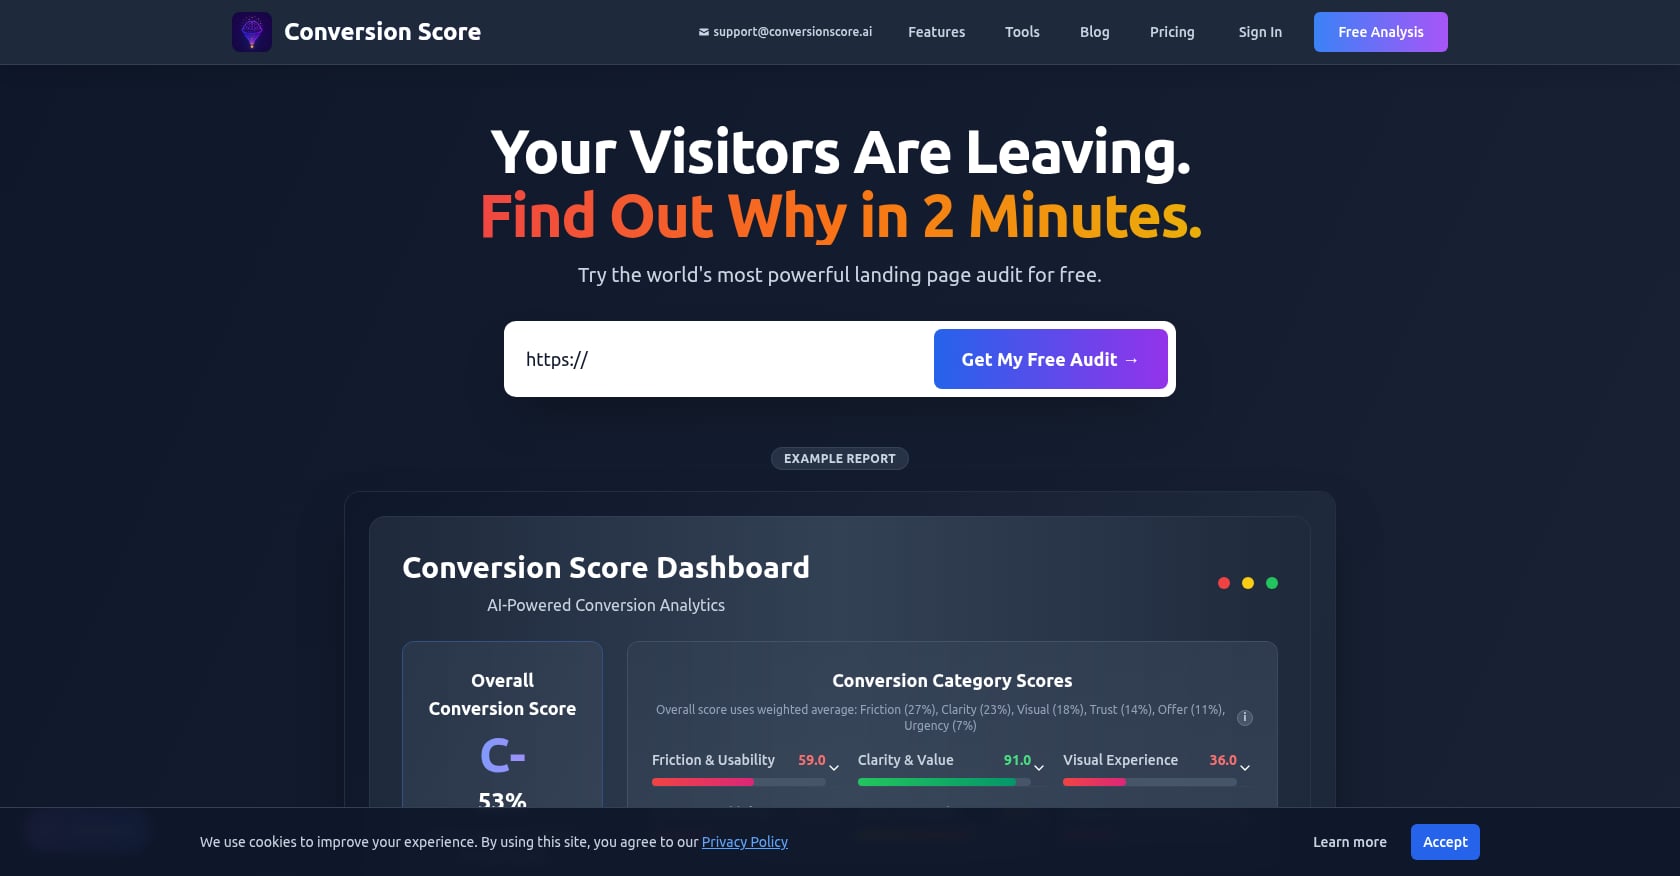
Conversion Score uses GPT-5 Vision and DOM analysis to evaluate your landing page across six weighted pillars: Clarity & Value, Offer Strength, Trust & Credibility, Friction & Usability, Urgency & Motivation, and Visual Experience. Paste a URL, and in about 90 seconds you get a single ConversionScore™ with prioritized, explained recommendations. No script installation. No waiting days for traffic data to accumulate. No weeks-long consulting engagement.
The free tier delivers an immediate analysis with top insights. Pro ($99/month) unlocks unlimited audits, competitor side-by-side comparisons, SWOT insights, AI expert chat for clarifying findings and drafting copy alternatives, and one-click PDF report downloads for client or stakeholder delivery.
Practitioners on Reddit testing various landing page analyzers noted that most free AI tools “cover the basics well but often miss psychological triggers and persona-specific messaging that drives real conversion improvements.” Conversion Score’s six-pillar framework addresses this gap by scoring trust signals, urgency cues, and offer clarity alongside the more obvious friction and usability checks, then packaging findings into a step-by-step action plan rather than raw data you have to interpret yourself.
Microsoft Clarity, by contrast, is free and provides solid session replay and heatmap data (practitioners on Reddit describe it as “basically Microsoft’s free version of Hotjar” with surprisingly few usage limits). But it shows behavior without telling you what to change. The two tools complement each other well: use Conversion Score to identify what to fix, then use Clarity or Hotjar to validate behavior changes after implementing those fixes.
What to do:
- Run a free analysis on your highest-traffic landing page right now.
- Review the prioritized recommendations and note which pillar scores lowest.
- Use the results to decide which of the 10 tactics below to implement first.
- For agencies or multi-page optimization, upgrade to Pro for unlimited audits with competitor benchmarks and downloadable PDF reports.
- After implementing changes, re-audit the page to track score improvements over time.
For a deeper comparison of AI-driven and traditional approaches, read AI analysis vs. traditional testing.
2. Simplify and Shorten Your Forms
Best for: Any page with a lead capture form of 4+ fields.
Measured impact: Up to 120% conversion lift.
This is the single highest-impact change you can make to a landing page, and it’s often the easiest to implement. One widely cited study found that reducing form fields from 11 to 4 increased conversions by 120%. Each additional form field drops conversions by roughly 4-8%.
The principle is straightforward: every field you ask someone to fill out is a moment where they reconsider whether the effort is worth it. Ask yourself which fields you actually need at the point of capture versus what you could collect later through progressive profiling.
Practitioners on Reddit’s r/PPC community have shared that form simplification is often the quickest win in any CRO audit. One practitioner described a SaaS client where simplifying a demo request form (a 30-minute implementation) produced a 28% increase in demo requests, while a full homepage redesign that would have taken six weeks was deprioritized.
What to do:
- Audit every field. Remove any that aren’t essential for the immediate next step.
- Consider multi-step forms that feel less overwhelming than a single long form.
- Use smart defaults and auto-fill wherever possible.
- Test a two-field version (email + name) against your current form.
Walk through our CRO checklist to evaluate whether your forms, among other elements, are creating unnecessary friction.
3. Fix Message Match Between Ads and Landing Pages

Best for: Pages receiving paid traffic where the headline doesn’t mirror the ad copy.
Measured impact: Up to 50% conversion lift; generic headlines convert 30-50% worse than specific ones.
If your ad says “AI Marketing Tools for Agencies” and your landing page headline says “All-in-One Marketing Platform,” you’ve broken the visitor’s expectation. They clicked because of a specific promise. When the page doesn’t immediately reinforce that promise, trust drops and bounce rates spike.
This is one of the most common conversion rate optimization problems on landing pages, and one of the most overlooked. Landing pages with consistent messaging from ad to page can improve conversion by as much as 50%.
What to do:
- Match the exact phrasing from your ad in the landing page headline.
- Create dedicated landing pages for each ad group instead of sending all traffic to one generic page.
- Check that the visual style (colors, imagery) feels consistent between ad and page.
- If you’re running multiple ad variants, you need multiple landing page variants.
For a deeper breakdown of what belongs on your page and how to structure it, read our guide to critical landing page elements.
4. Optimize Your Headline and Above-the-Fold Experience
Best for: Pages with high bounce rates or low scroll depth.
Measured impact: Headline optimization alone delivers 27-104% conversion lift.
The first viewport carries roughly 80% of the conversion weight. Visitors decide within seconds whether to stay or leave, and that decision happens above the fold.
One case study that circulates widely in CRO circles found that changing a CTA from “Sign up for free” to “Trial for free” resulted in a 104% increase in trial starts. The reasoning: “sign up” implies an ongoing commitment, while “trial” implies temporary evaluation with no strings attached.
The average high-performing H1 headline contains under 8 words (44 characters maximum). This constraint forces clarity. If your headline requires 15 words, it’s probably trying to communicate too many things at once.
Required above-the-fold elements:
- Clear headline stating what you do and for whom
- Value proposition (why you, not them)
- Visual representation of the product or service
- Primary CTA button
- At least one social proof element (logo bar, rating, testimonial snippet)
5. Enforce a Single Primary CTA
Best for: Pages with multiple competing calls to action, navigation links, or social media icons.
Measured impact: Multiple CTAs reduce conversion by 15-30%. Pages with more than one offer can see conversion drops of up to 266%.
A landing page should have an attention ratio of 1:1. One goal, one action. Every navigation link, social media icon, or secondary CTA is an exit ramp that dilutes focus.
Yet 48% of landing pages have more than one offer. That’s half of all landing pages essentially competing against themselves.
A practitioner from Greenlane Marketing shared a telling example: “Even something seemingly simple like an accidentally visible navigation menu could dramatically decrease conversions. That exact use case was responsible for killing conversions for a past client.”
What to do:
- Remove global navigation from landing pages.
- Kill social media icons and footer links.
- If you must have a secondary CTA (“Watch demo” alongside “Start free trial”), make the secondary visually subordinate through a ghost button or text link.
- Repeat the single primary CTA at logical intervals on longer pages.
6. Add Social Proof Above the Fold
Best for: Pages lacking testimonials, review counts, client logos, or trust badges.
Measured impact: Customer testimonials increase conversions by 34%. Displaying reviews can boost conversions up to 270%.
Here’s a staggering gap: 76.8% of marketers don’t include social proof on their landing pages. That means only about 1 in 4 marketers are using testimonials, review snippets, or trust badges. This is one of the easiest wins available.
Social proof works because it addresses the buyer’s core fear: “Am I making a mistake?” Addressing buyer objections directly can increase conversion rates by roughly 80%.
What to do:
- Add a client logo bar immediately below the headline.
- Include one specific testimonial with a name, title, and photo (not “John D., Happy Customer”).
- Show aggregate review scores (“Rated 4.8/5 from 2,400+ reviews”).
- Place trust badges (security seals, certifications, “as seen in” logos) near the CTA.
For the psychology behind why these signals work, read about how visitor psychology drives conversions.
7. Crush Page Speed (Target Under 2.5s LCP)
Best for: Pages that take more than 3 seconds to load, particularly on mobile.
Measured impact: Pages loading in 1 second have 3x higher conversion rates than pages loading in 5 seconds. Every 0.1-second improvement lifts conversions by 8-10%.
A good Largest Contentful Paint (LCP) figure can increase conversion by up to 61%. Meanwhile, 53% of mobile users abandon sites that take longer than 3 seconds to load.
Speed isn’t just a nice-to-have. It’s a conversion rate optimization fundamental for any landing page, and it compounds with every other fix on this list. A perfectly written headline doesn’t matter if visitors bounce before they see it.
What to do:
- Compress and lazy-load images.
- Minimize JavaScript that blocks rendering.
- Use a CDN for static assets.
- Test with Google PageSpeed Insights and aim for an LCP under 2.5 seconds.
- Consider removing video auto-play on mobile.
8. Close the Mobile Conversion Gap
Best for: Any page where mobile traffic makes up more than half of visitors (which is most pages).
Measured impact: Mobile accounts for roughly 83% of all landing page visits but converts at approximately 1.8%, less than half the 3.9% desktop average.
This is the most underinvested area in conversion rate optimization for landing pages. Desktop rates average 4.8-5.06% compared to mobile’s 2.49-2.9%, a gap of 40-51%. Most landing pages aren’t mobile-hostile. They’re mobile-inconvenient. Small tap targets, forms that require horizontal scrolling, CTAs that disappear below the fold.
What to do:
- Use single-column layouts exclusively on mobile.
- Make CTAs at least 44x44 pixels (Apple’s human interface guideline for tap targets).
- Ensure sub-3-second load times on 4G connections.
- Place the primary CTA within the first viewport on mobile.
- Test your forms on an actual phone, not just a browser resize.
For a complete strategy on this topic, see our guide to mobile-first conversion strategies.
9. Write at a 5th-7th Grade Reading Level
Best for: Pages with “professional” or jargon-heavy copy, especially in B2B.
Measured impact: Pages written at a 5th-7th grade reading level convert at 11.1%, nearly double the 5.3% rate of “professional” copy.
This stat surprises people, but the data is clear. Simpler copy converts better. Not because your audience is unsophisticated, but because simple language reduces cognitive load. When someone is scanning a landing page, they’re not reading a whitepaper. They’re making a fast decision.
“Professional” copy full of industry jargon, compound sentences, and passive voice makes that decision harder. Plain language makes it easier.
What to do:
- Run your copy through a readability tool (Hemingway Editor is free).
- Target a Flesch-Kincaid grade level of 5-7.
- Replace jargon with everyday equivalents.
- Use short sentences. Short paragraphs. Active voice.
- Read your page out loud. If you stumble, simplify.
10. A/B Test Systematically, Not Randomly
Best for: Teams that have already identified high-priority changes and need to validate them.
Measured impact: Marketers who A/B test see 37% conversion gains, yet only 17% actively do it.
That gap between adoption and impact is remarkable. The reason most teams don’t test isn’t lack of tools. It’s lack of discipline and process.
Rules for meaningful tests:
- Test one variable at a time.
- Run for a minimum of 2 weeks (to capture day-of-week variation).
- Require 95%+ statistical confidence before declaring a winner.
- Document every test, including losers. Failed tests teach you about your audience.
- High-performing teams run 2-3 tests monthly, building compound improvements over time.
Random testing (“Let’s try a green button instead of blue”) rarely produces lasting insights. Structured testing starts with a hypothesis grounded in data. An AI audit that identifies weak trust signals, for instance, gives you a testable hypothesis: “Adding a client logo bar above the fold will increase form submissions by X%.”
Plan your next experiments with the A/B test planner, which helps you calculate sample sizes and timeline before you commit resources.
11. Use Urgency and Scarcity (Only When Real)
Best for: Pages promoting time-bound offers, limited availability products, or cohort-based programs.
Measured impact: Real urgency can increase conversion significantly, but fake urgency destroys trust and damages long-term brand perception.
Countdown timers that reset every time you visit the page. “Only 3 left!” on a digital product with infinite inventory. Visitors see through these tactics instantly, and they erode the trust you’ve spent the rest of your page building.
Real urgency works because it’s true:
- “Webinar starts Tuesday at 2 PM ET” (real deadline)
- “Enrollment closes Friday” (real cohort limit)
- “7 spots left in the Q2 cohort” (real capacity constraint)
- “Price increases June 1” (real pricing change)
If your offer doesn’t have a natural deadline, don’t manufacture one. Focus on the other 10 tactics instead.
Common Landing Page CRO Mistakes to Avoid
Even experienced marketers fall into these traps:
Ignoring traffic source quality. If your conversion rate is 1.5% and all your traffic comes from broad social media campaigns, the problem might not be the page. Email converts at 19.3%, organic search at 2.7%, and social media at roughly 1.5%. Segment your data before blaming the landing page.
Optimizing for the wrong metric. A higher form submission rate means nothing if those leads never convert to customers. Track downstream metrics, not just the landing page event.
Copying competitors without context. Just because a competitor uses a long-form page doesn’t mean you should. Their audience, offer, and traffic sources are different. Analyze competitors for insights, not templates.
Testing too many things at once. Multivariate testing sounds sophisticated, but it requires massive traffic volumes to reach significance. Most landing pages don’t get enough traffic for anything beyond simple A/B tests.
Stopping after one round. CRO is a process, not a project. The teams that see compounding gains treat optimization as an ongoing discipline. As one CRO strategist noted in a 2026 industry guide: “AI is everywhere in CRO conversations, but the winning brands aren’t using it to automate optimization. They’re using it to scale relevance, because relevance reduces hesitation.”
Your Conversion Rate Optimization Landing Page Action Plan
Here’s the priority order based on the data:
- Audit your current state. Know your baseline conversion rate, traffic sources, and how you compare to benchmarks.
- Fix the obvious friction. Simplify forms, fix message match, enforce a single CTA.
- Build trust. Add social proof, testimonials, and trust badges above the fold.
- Improve the technical foundation. Page speed, mobile experience, readability.
- Test and iterate. Use structured A/B tests to validate changes and compound gains.
The fastest way to move through step one is to get a free page analysis that scores your page across all six conversion pillars and tells you exactly what to prioritize. For teams and agencies running multiple pages, Conversion Score Pro offers unlimited audits with competitor comparisons, SWOT insights, and downloadable PDF reports.
Stop guessing. Start with the data.
FAQ
What is a good conversion rate for a landing page?
The median across all industries is 6.6%, based on Unbounce’s analysis of 41,000 landing pages. However, this varies significantly by industry (SaaS averages 3.8%, financial services 8.4%) and by traffic source (email at 19.3%, organic at 2.7%). A “good” rate is one that beats your industry median and improves consistently over time.
How do I start optimizing my landing page for conversions?
Start with an audit that identifies your biggest gaps. The most impactful fixes, in order, are form simplification (120% lift potential), message match between ads and page (up to 50% lift), and headline optimization (27-104% lift). Don’t skip straight to A/B testing without knowing what to test first.
What’s the biggest mistake people make with landing page CRO?
Having multiple competing CTAs. 48% of landing pages include more than one offer, and this can reduce conversion by up to 266%. A landing page should have a 1:1 attention ratio: one goal, one action. Remove navigation menus, social icons, and secondary offers.
Do I need expensive tools for conversion rate optimization?
No. You can start with free tools like Microsoft Clarity for heatmaps and session recordings, Conversion Score’s free analysis for a prioritized diagnostic, and Google PageSpeed Insights for performance. Paid tools become valuable when you need ongoing testing (VWO, Crazy Egg) or unlimited audits across multiple pages.
How long should I run an A/B test on my landing page?
A minimum of 2 weeks to account for day-of-week variation, and you should require 95% statistical confidence before calling a winner. Ending tests early because one variant “looks better” after a few days leads to false positives and wasted optimization cycles.
Why is my mobile conversion rate so much lower than desktop?
Mobile accounts for 83% of landing page traffic but converts at roughly half the desktop rate. The typical causes are small tap targets, forms that don’t work well on small screens, CTAs that fall below the fold, and slow load times on cellular networks. The fix isn’t a responsive template; it’s designing mobile-first with thumb-friendly interactions and sub-3-second load times.
Does page speed really affect conversion rates?
Yes, dramatically. Pages that load in 1 second convert at 3x the rate of pages that load in 5 seconds. Every 0.1-second improvement translates to an 8-10% lift in conversions. A strong LCP score alone can increase conversion by up to 61%. Speed is not optional for serious conversion rate optimization on landing pages.
Should I use AI tools for landing page optimization?
AI tools are most valuable as diagnostic tools that help you prioritize what to fix. They’re fast (90 seconds versus weeks for a manual audit) and can catch issues like weak trust signals, unclear value propositions, and mobile usability problems. They don’t replace testing, but they dramatically reduce the time between “something’s wrong” and “here’s what to test first.”
Read more guides on the CRO blog, run a free conversion audit on your own site, or see Pro plans for unlimited audits.